
Entry Techniques for Differing Timeframes

In my “Portfolio Update” and “Chart Talk” posts my subscribers have gotten used to hearing me say “I entered on a breakout of the DTL”, “I bought on a retest of the 267ema (gold band)”, “I bought the HL (higher-low)" breakout”. What are these terms referring to? I’ve compiled all my entry techniques into the following chart for easy reference and farther down I explain each of these as well as the conditions under which each entry is the best.
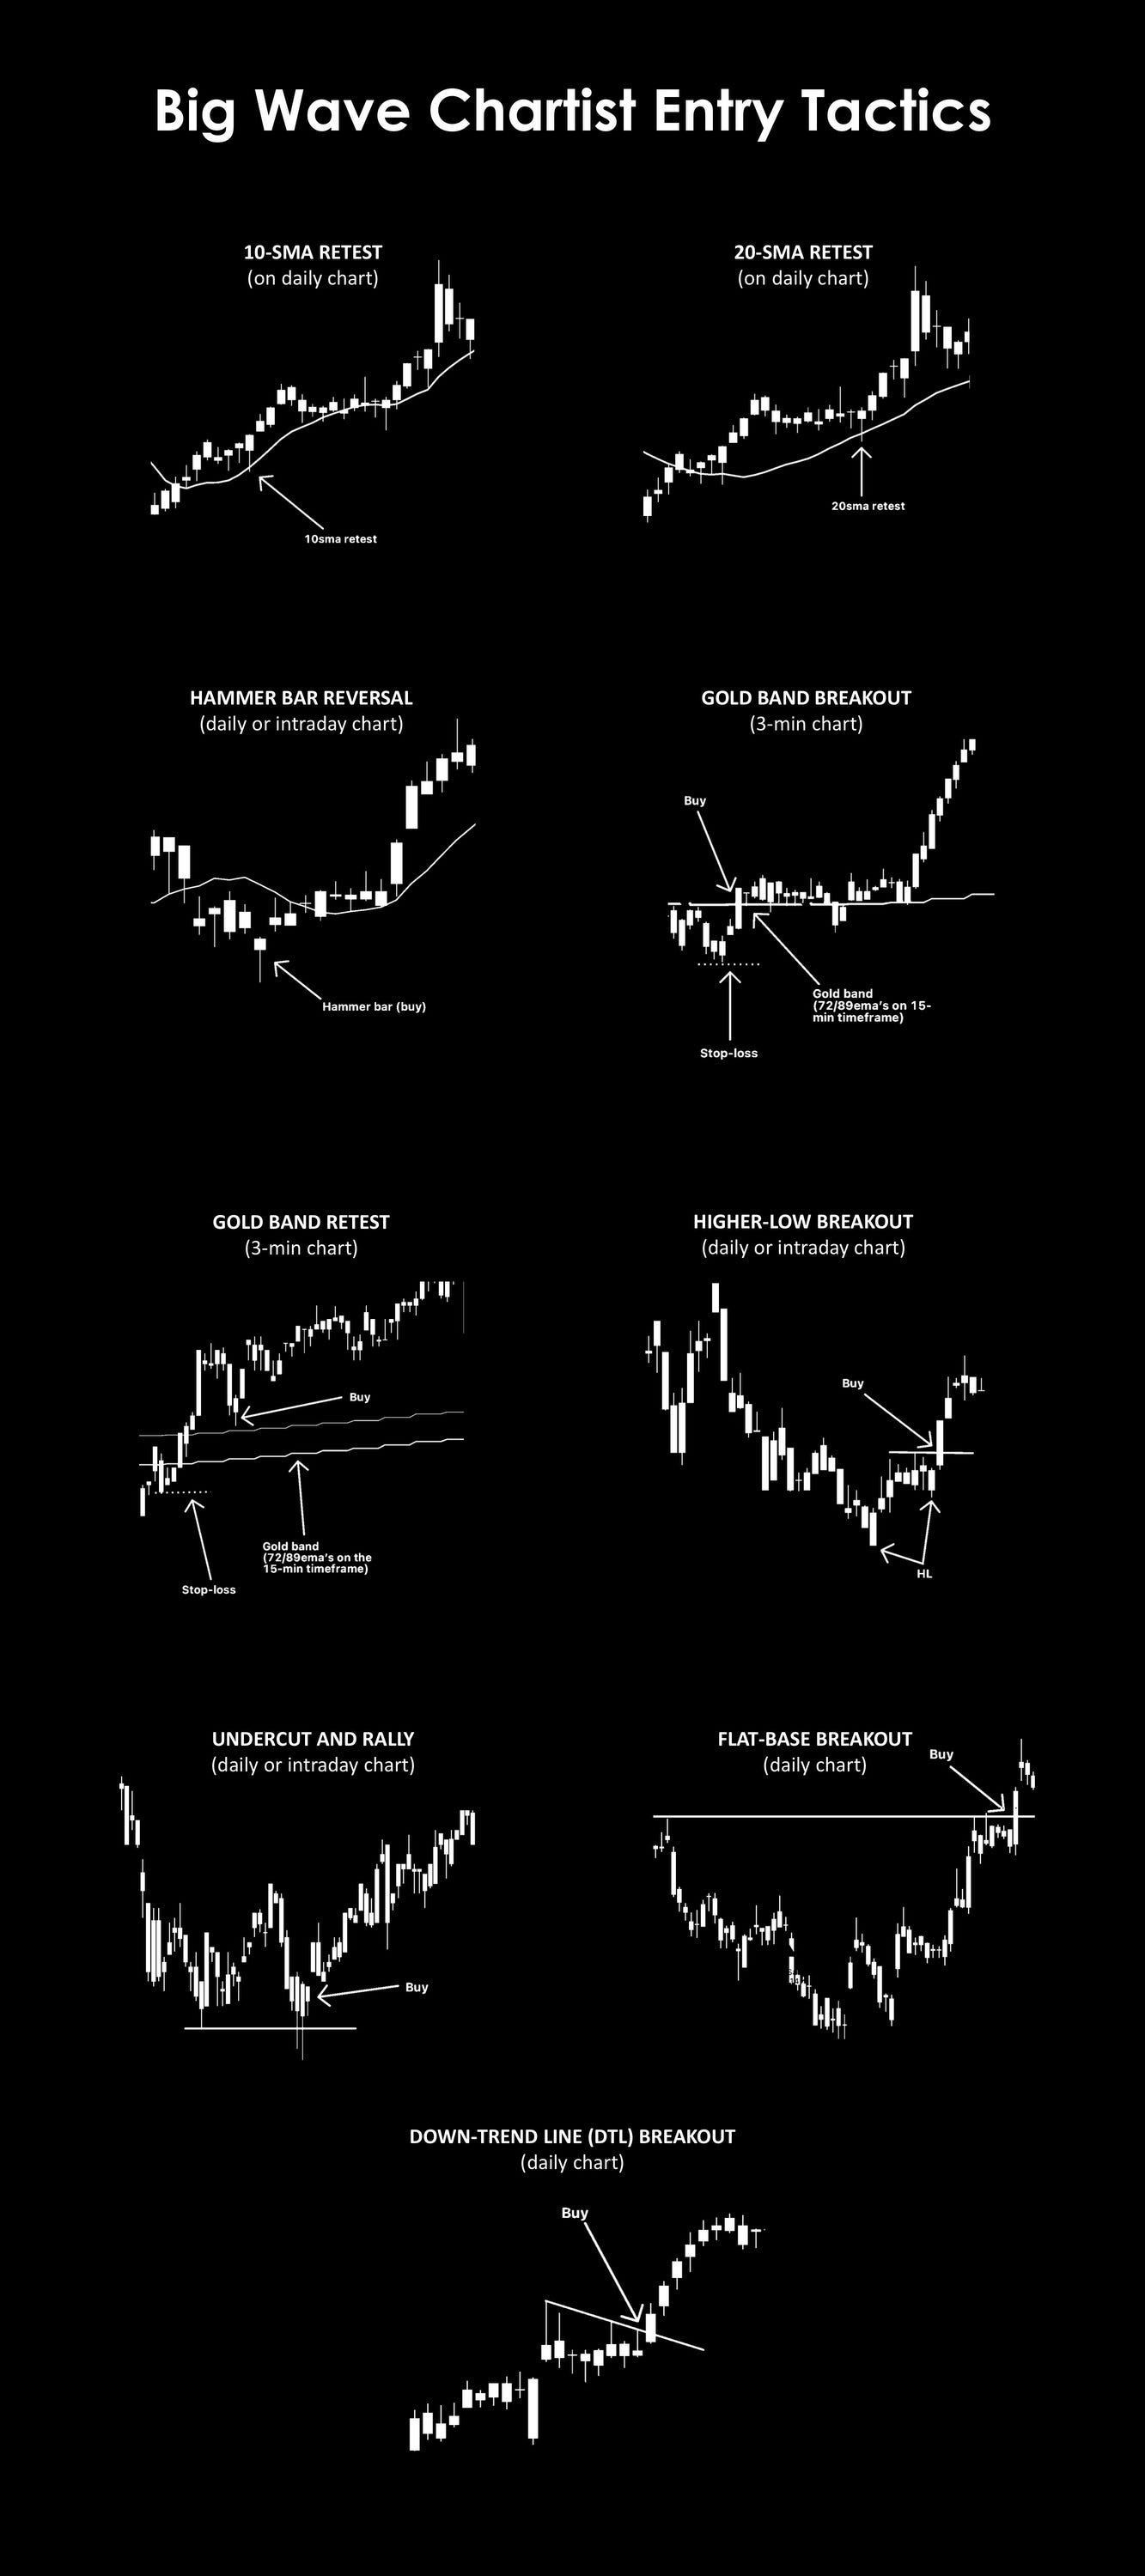
Let’s give a brief overview of each of these…
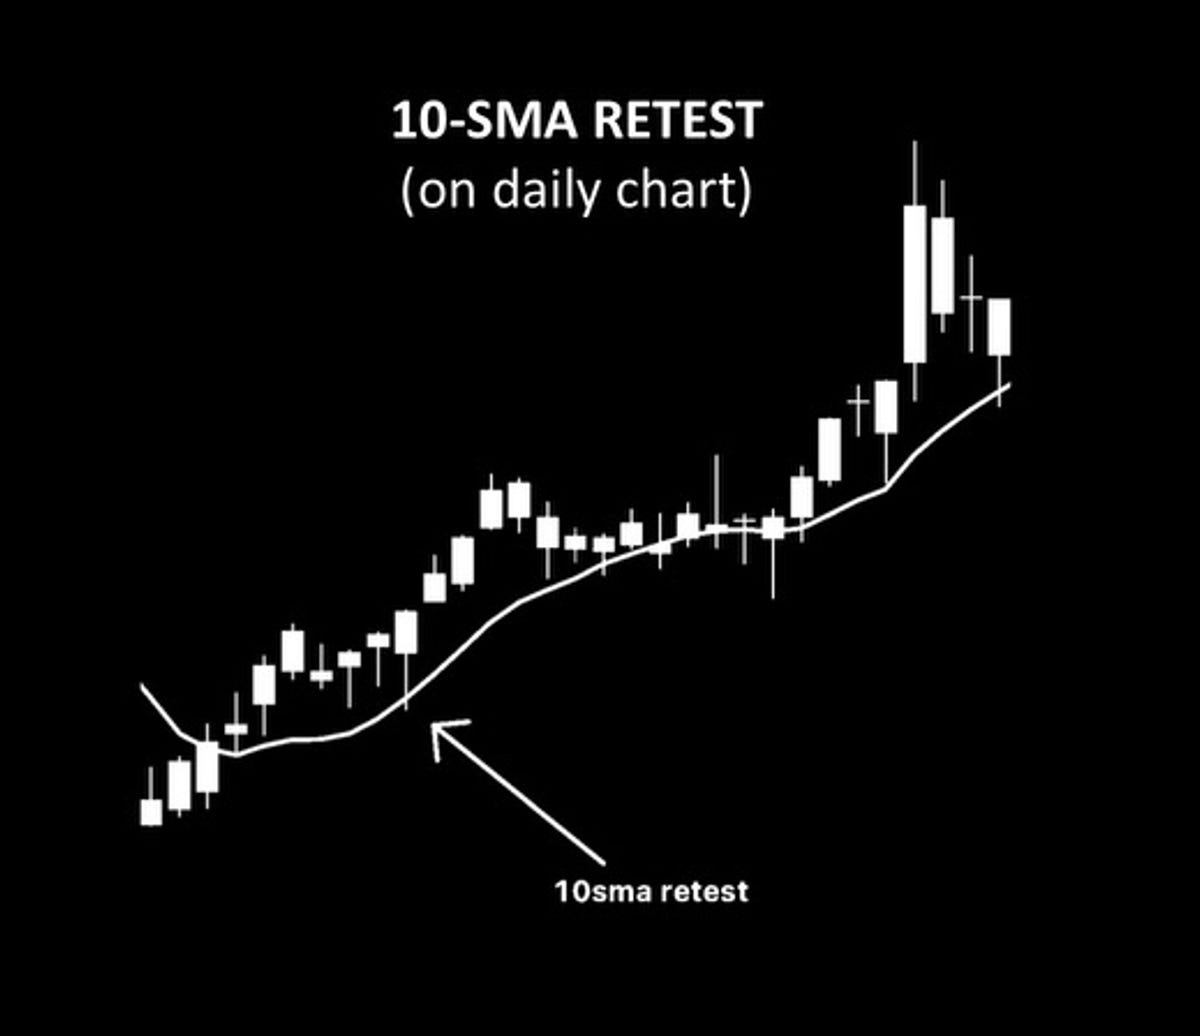
10-SMA RETEST:
This is when price breaks above the 10sma and then pulls back to retest that moving average again. It’s good to look back and see how the stock has acted around the 10sma previously. Was it supported there, perhaps a couple times? The likelihood of it doing that again is increased. This setup is usually best for a very strong stock that has too much momentum to pull all the way back to the 20sma in a general market pullback.
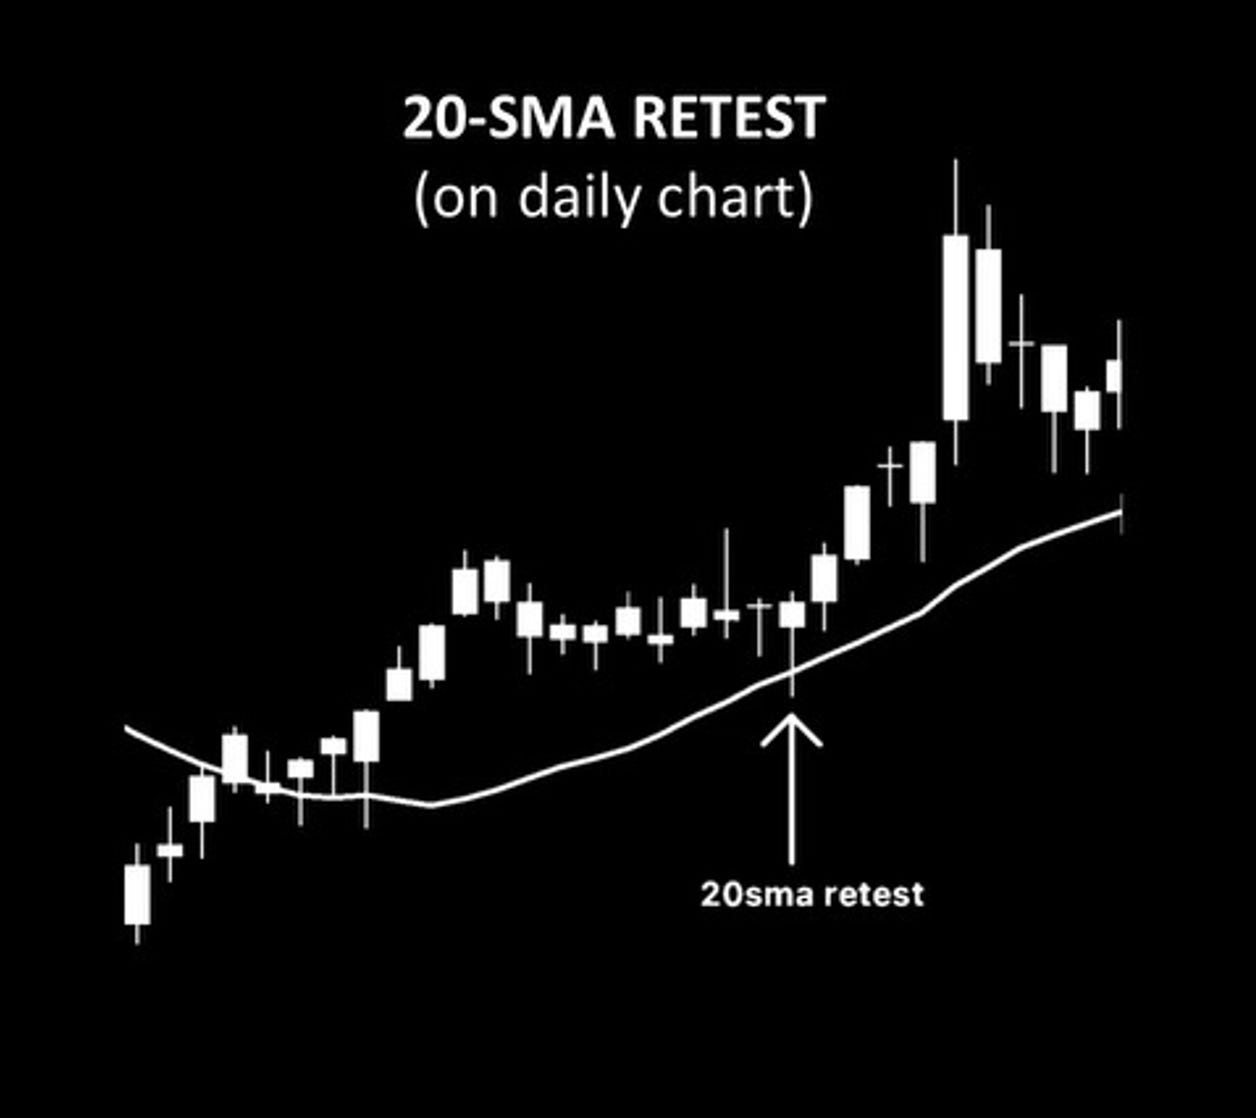
20-SMA RETEST:
All the same points for the 10-sma retest apply to this setup as well. It’s important for price to have been supported at the 20sma before, which will increase the chance of success on this setup. This setup usually works best in a short-term general market pullback in a longer-term uptrend.
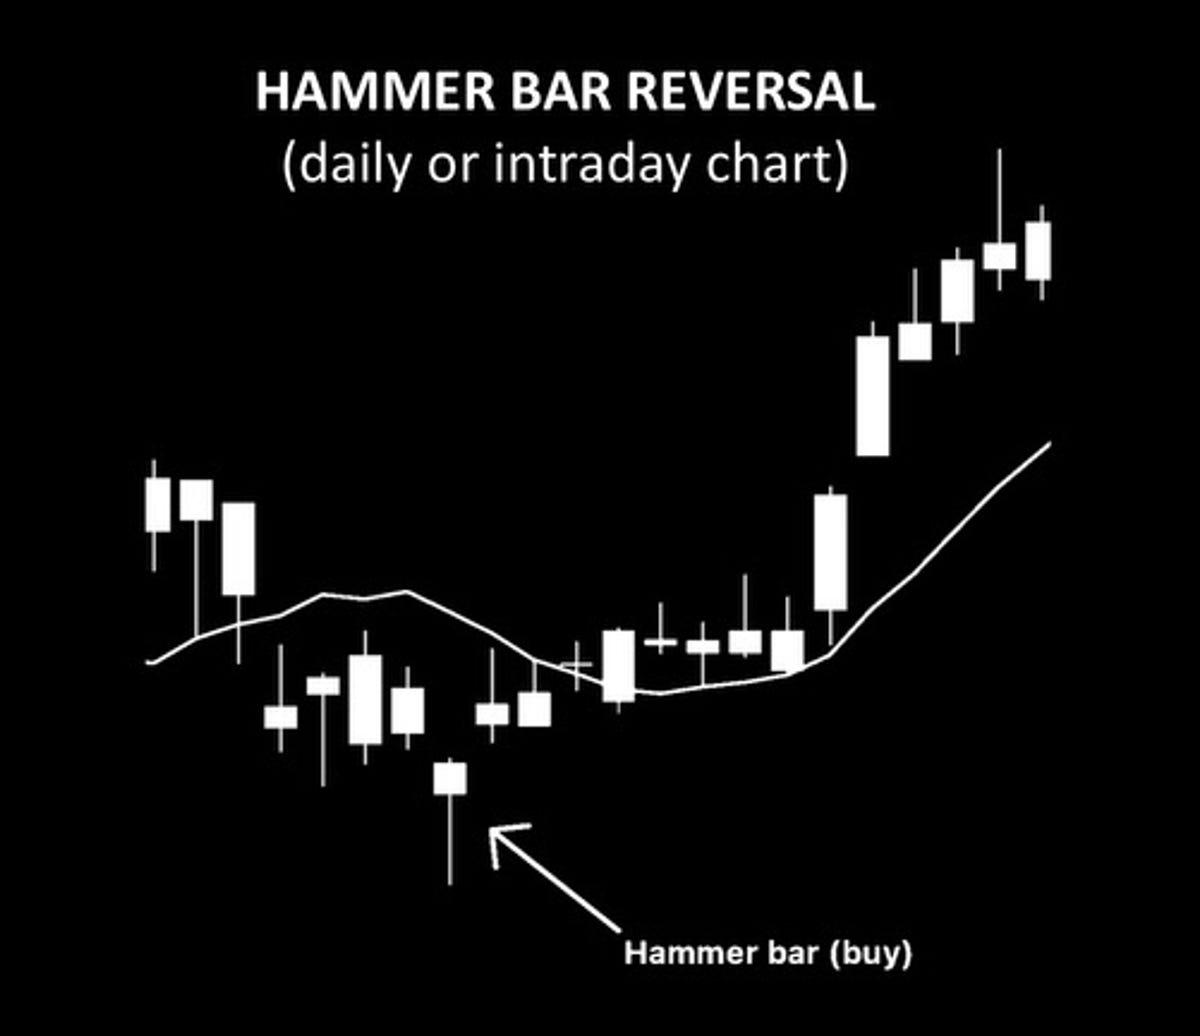
HAMMER BAR REVERSAL:
This setup can be an early indicator of a trend change. It usually opens down, drops and is quickly bought back up above the opening price level. This shows that buyers stepped in at lower prices refusing to allow it to drop any farther. For very tight risk I’ll zoom into intraday charts to go long when I see this candle bar develop.
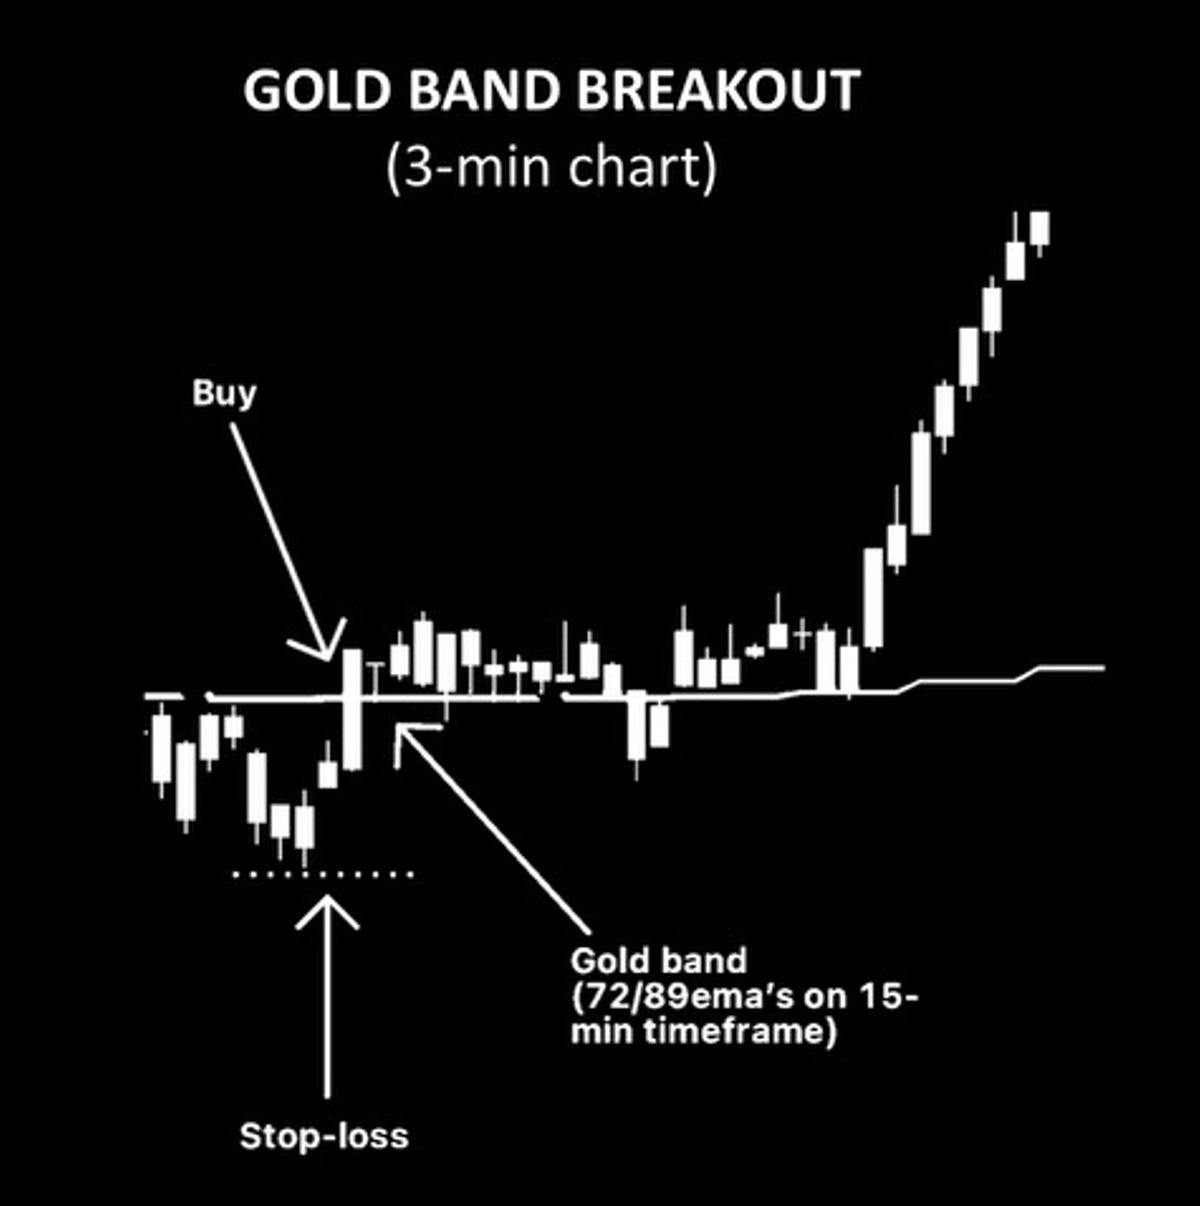
“GOLD BAND” BREAKOUT:
I often use the “gold band” for intraday entries. For more in-depth details of this approach checkout my article on Sniper Entries. Basically the “gold band” is a range of the 72ema and 89ema based on the 15-min chart and I plot it on the 3-min chart. This closely corresponds to the 267ema on the 3-min chart, but instead of using a single ema I now use the two-EMA range. These levels are areas that institutions and algo’s search out for reversals. I use the “gold band” technique to keep my risk very tight and then I base my stop-loss off the daily chart for swing holds. It’s basically a day trading sniper entry, with a swing trading timeframe in mind.
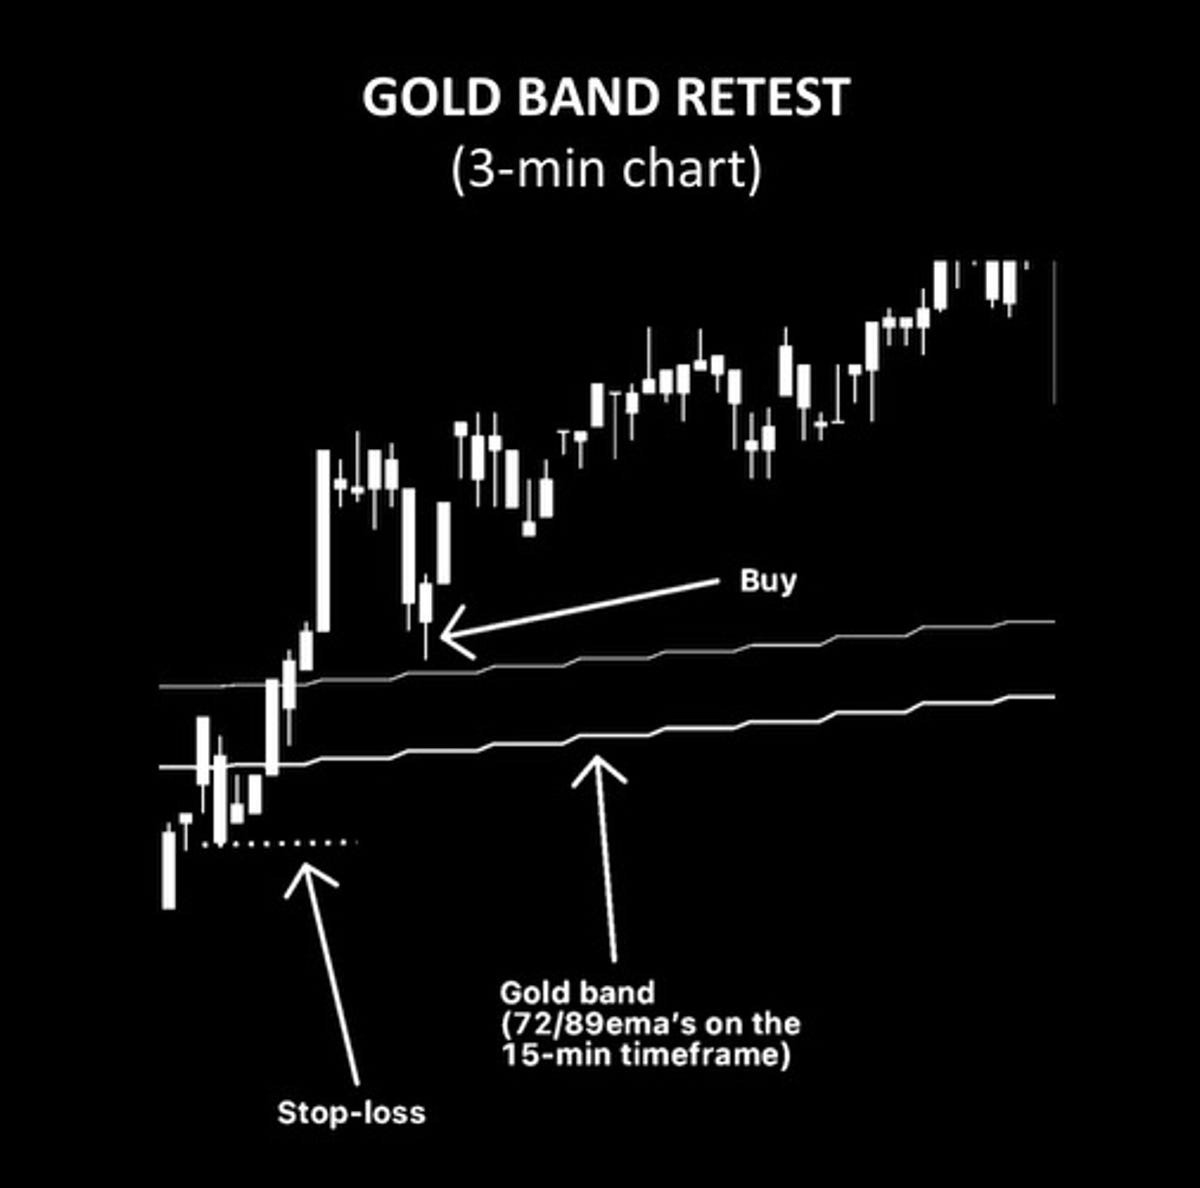
“GOLD BAND” RETEST:
If I miss the Gold Band (GB) breakout, then I’ll wait for a retest of the GB to enter. This can also give confirmation that the GB has changed from resistance to support.
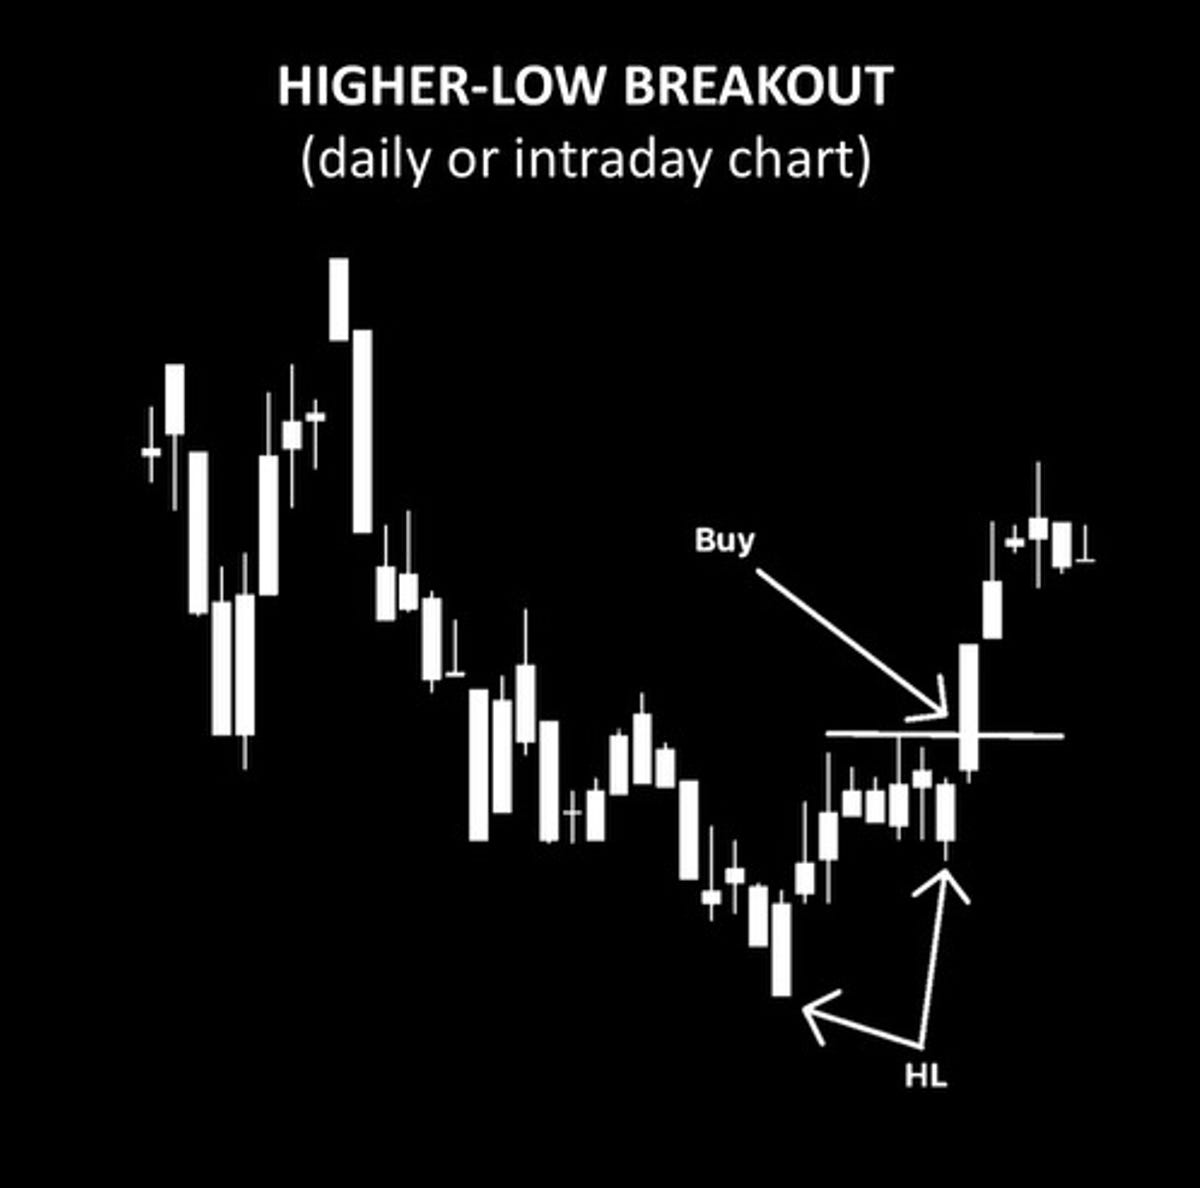
HIGHER-LOW BREAKOUT:
Higher lows are confirmation of a potential trend change. Higher lows develop after lower lows have consistently been created and finally sellers lose steam which causes an initial push higher, price consolidates - usually down and to the right - then pushes higher again, confirming the change in trend. A stop-loss could be placed just below the higher low for tight risk control.
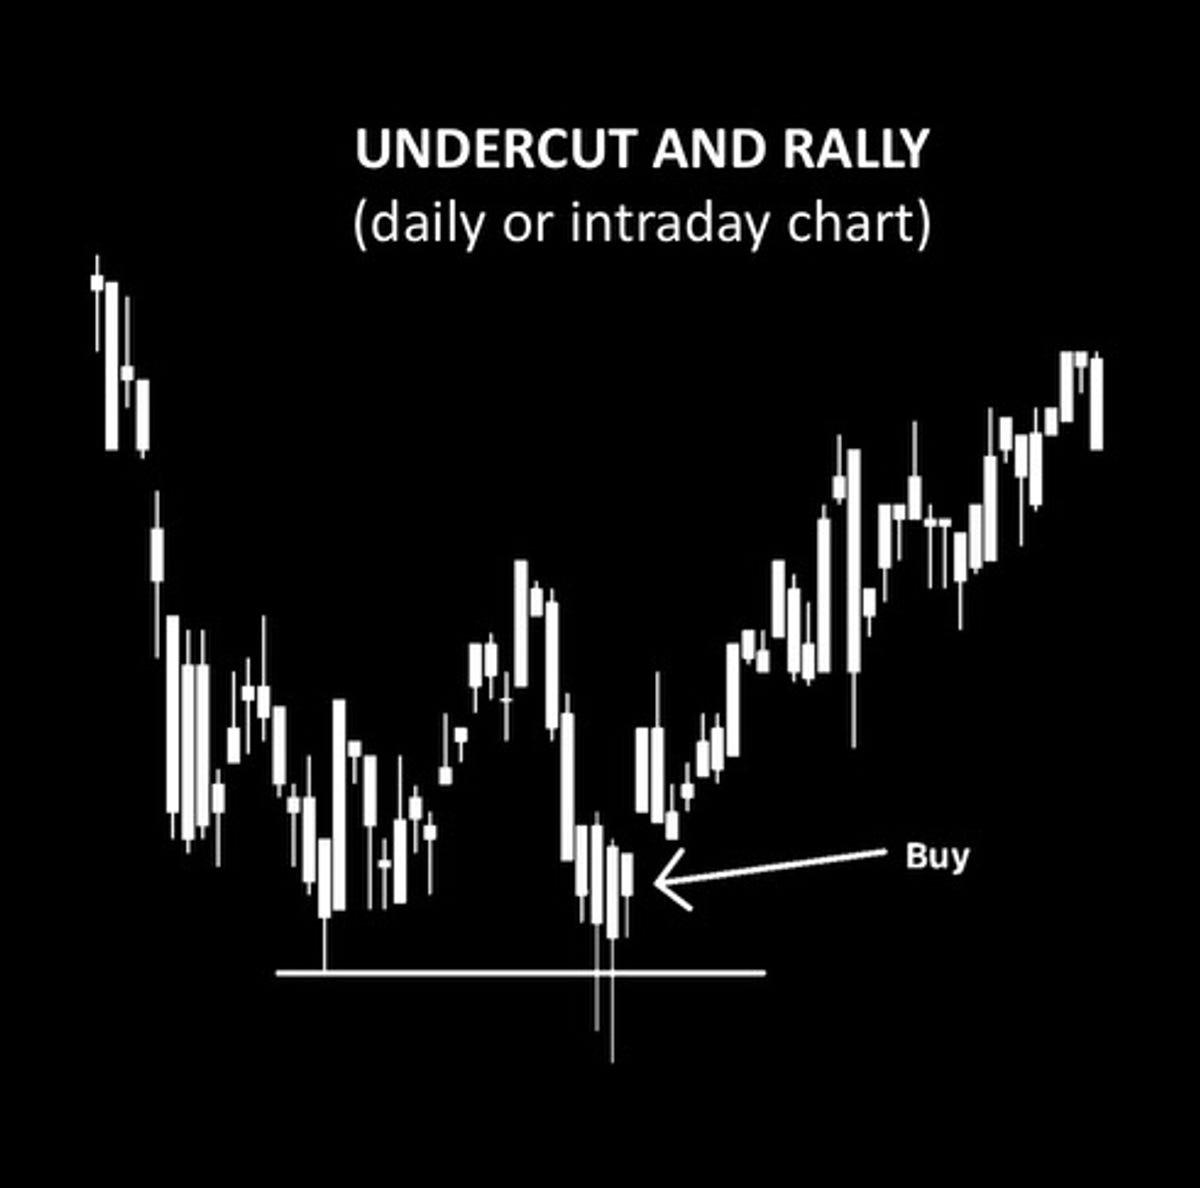
UNDERCUT AND RALLY (U&R):
If a higher-low setup fails, the next potential buy spot is an undercut and rally, so don’t immediately write-off a higher-low if it fails. For this setup, price created somewhat of a hammer bar reversal on the first low, rallied to what looks like somewhat of a higher-low, that failed and came back in to retest the recent low - falling below that level - but then quickly found buyers down there to buy it back up making a double-bottom. So if a hammer bar reversal takes shape which leads to a higher low breakout that fails, then a U&R could be the area to watch for the next entry.
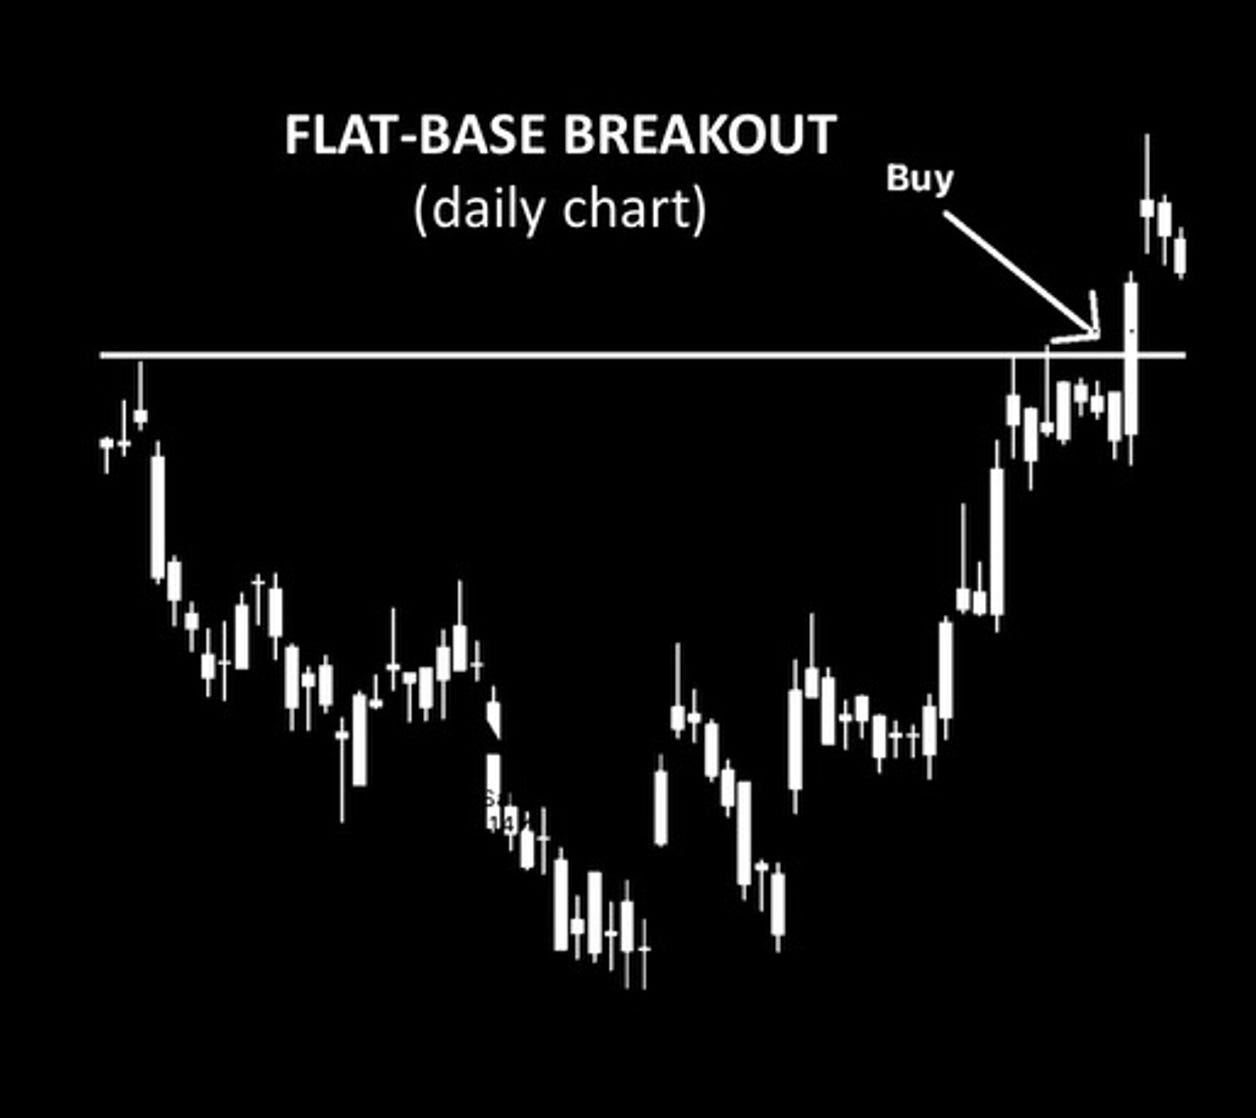
FLAT-BASE BREAKOUT:
This is pretty self-explanatory. Price creates a flat base, ideally with price moving from wide and loose on the left side of the chart and tightening in high/low swings as it moves to the right of the chart. It’s best if the base creates a low volume “handle” - or area of tight consolidation - on the upper right side, just below the flat base level before it breaks out on high volume. If you miss the initial breakout, price will often come back in to “test” the breakout level, providing another opportunity to get aboard before seeing higher prices.
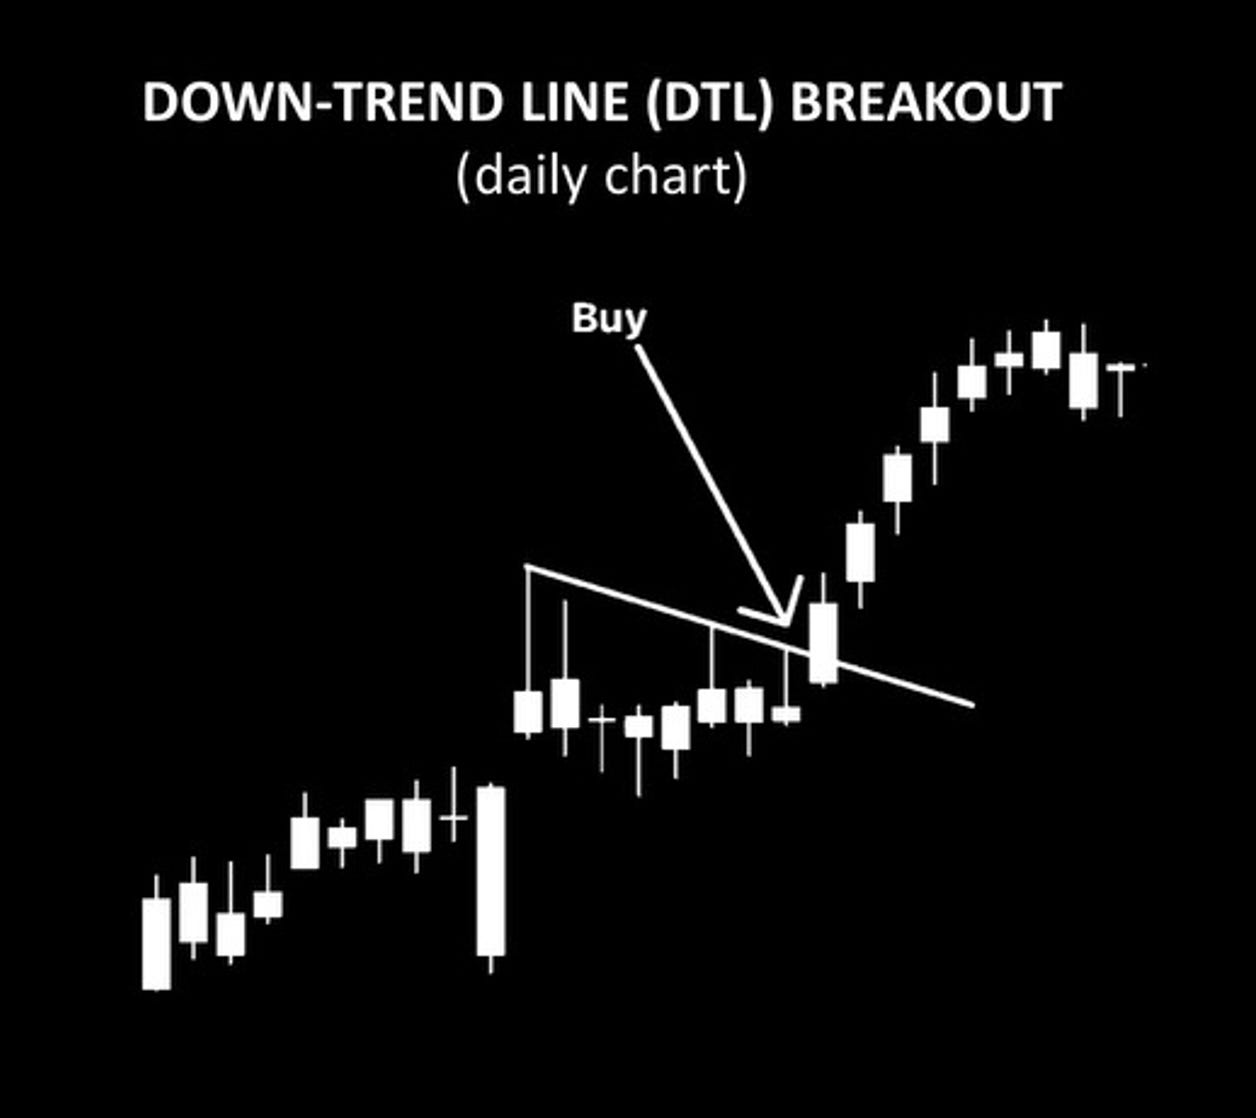
DOWN-TREND LINE (DTL) BREAKOUT:
Oftentimes, after a quick pop in price, price will start to consolidate down and to the right, reducing in volatility as it does so. This creates a nice gradual diagonal slope to the highs. Watch for a breakout of that level on high volume. A breakout of that level means that sellers on those highs have become exhausted and only buyers are left. If you miss the flat-base breakout above, the DTL breakout is usually the next best location to buy at.
I hope you enjoyed this break-down of my nine buy setups and hope that you’re able to identify some setups that may be beneficial to you, adapting them to your own trading style. Please leave a “like” on this post if you found it beneficial.
Happy trading!
-Big Wave Chartist